Enhancing reader experiences with user-focused infographics
Client
Services
Data analysis
Infographics
Information and data design
Storytelling
Deliverables
Content creation
Data analysis
Data visualization
Editorial infographics
Credits
Amanda Li, writer, “A week in the life clinic”
Leah Bens, writer, “Counting costs”
The project
When Jane App approached Michelle to create infographics for Front Desk magazine they started with bringing her raw survey data and a broad theme.
Through data analysis, Michelle and her collaborative Front Desk writers were able to envision stories that were unique to the survey data and the magazine’s readership. Both infographics required a deep dive into the numbers to understand their relevance to the Front Desk audience.
Together we crafted meaningful narratives that helped clinic owners understand their experience and how it related to their peers.
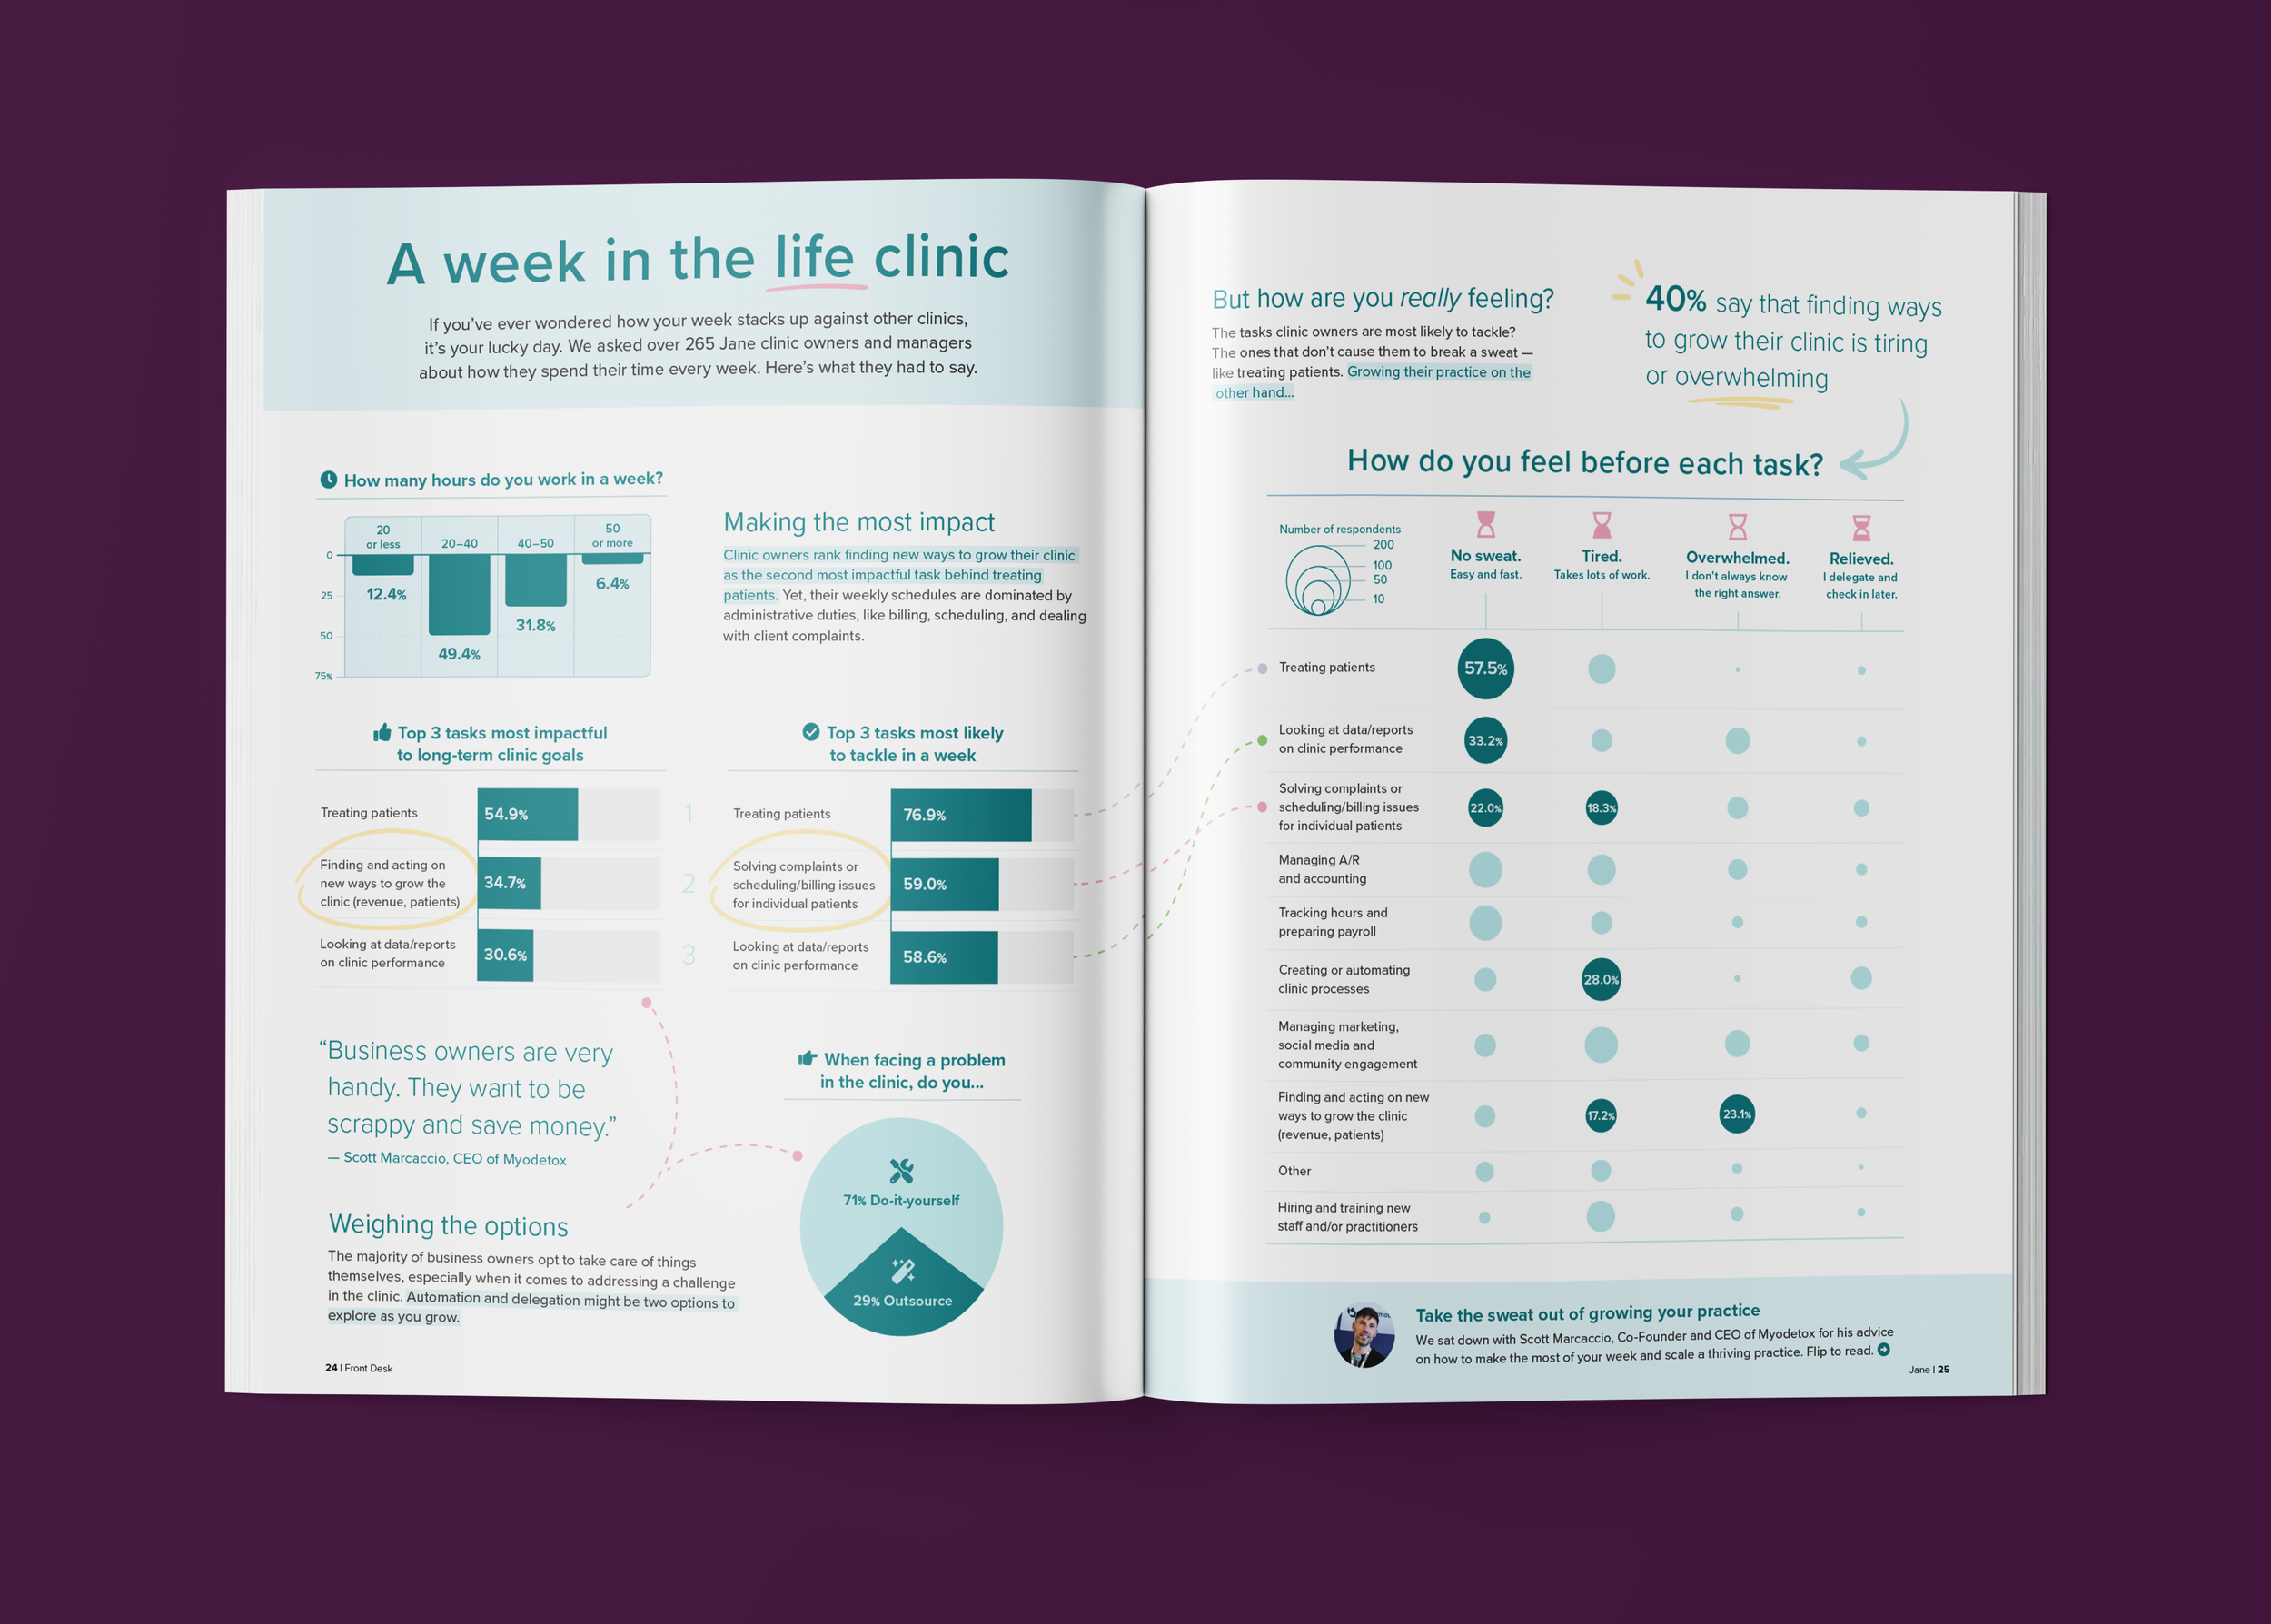
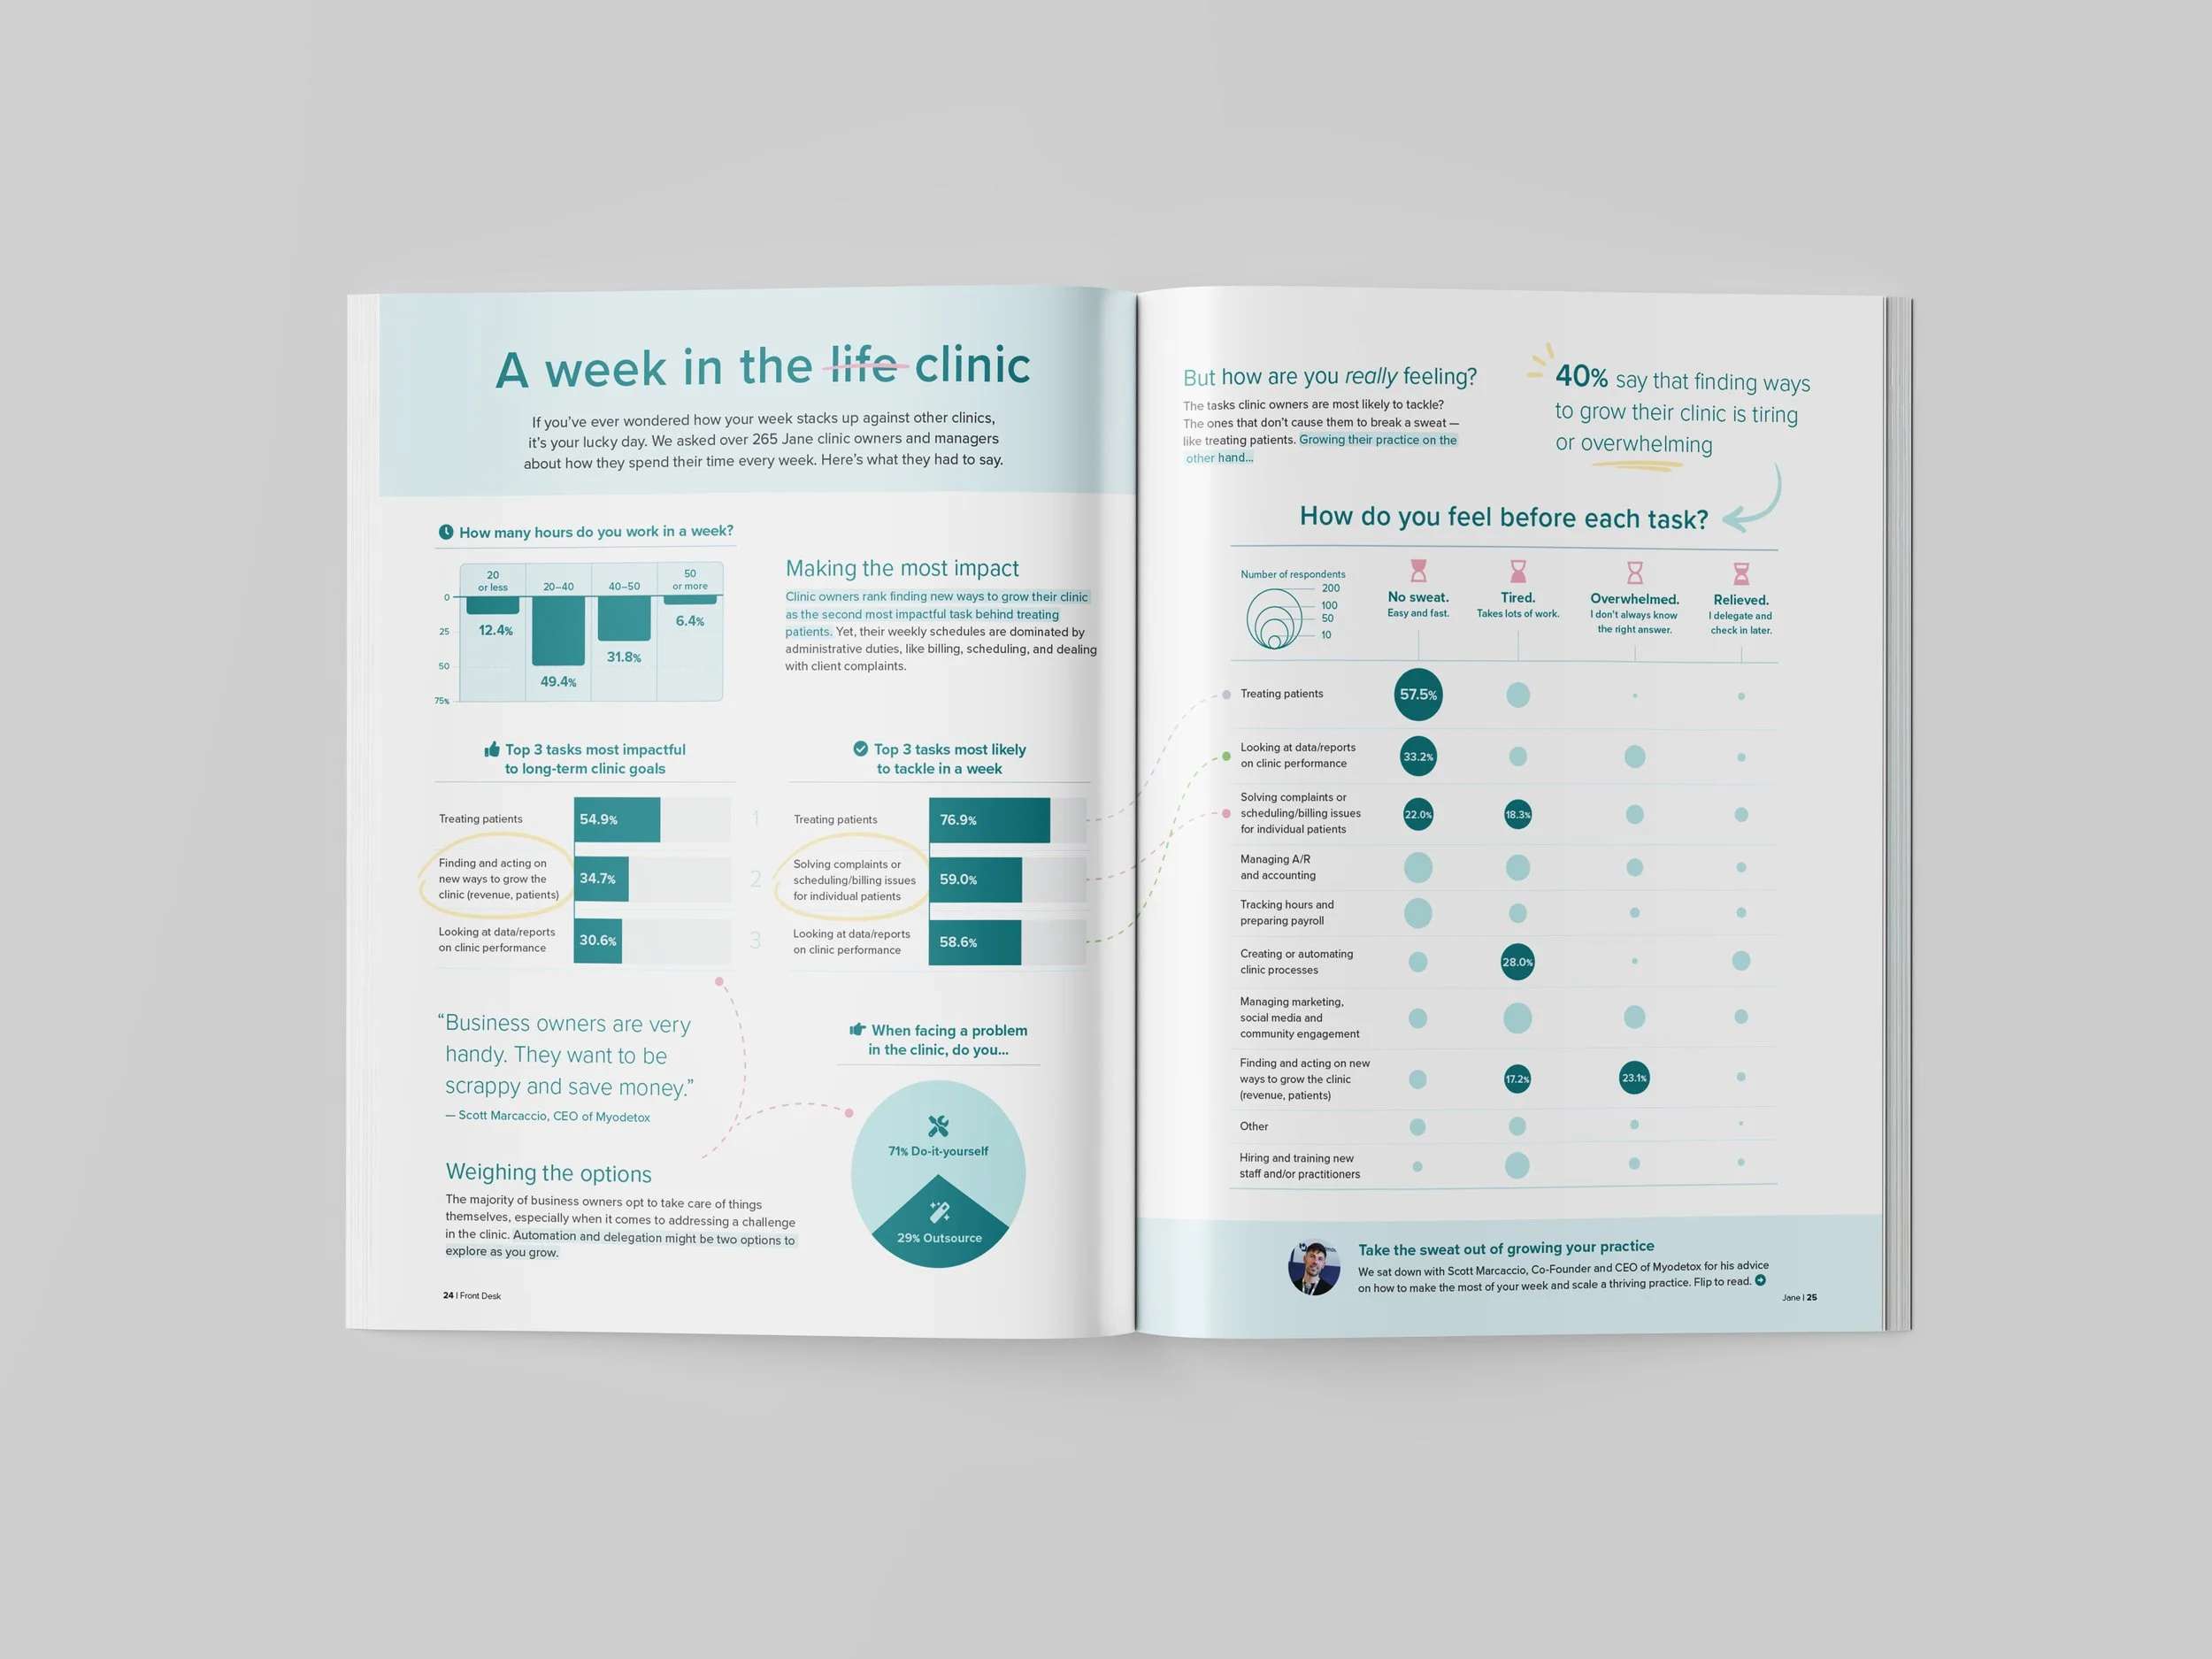
“A week in the life clinic” was featured alongside an interview about scaling your business. The infographic captures how Jane’s clinic owners spend their time, what tasks are challenging and how they feel about their to-do list.
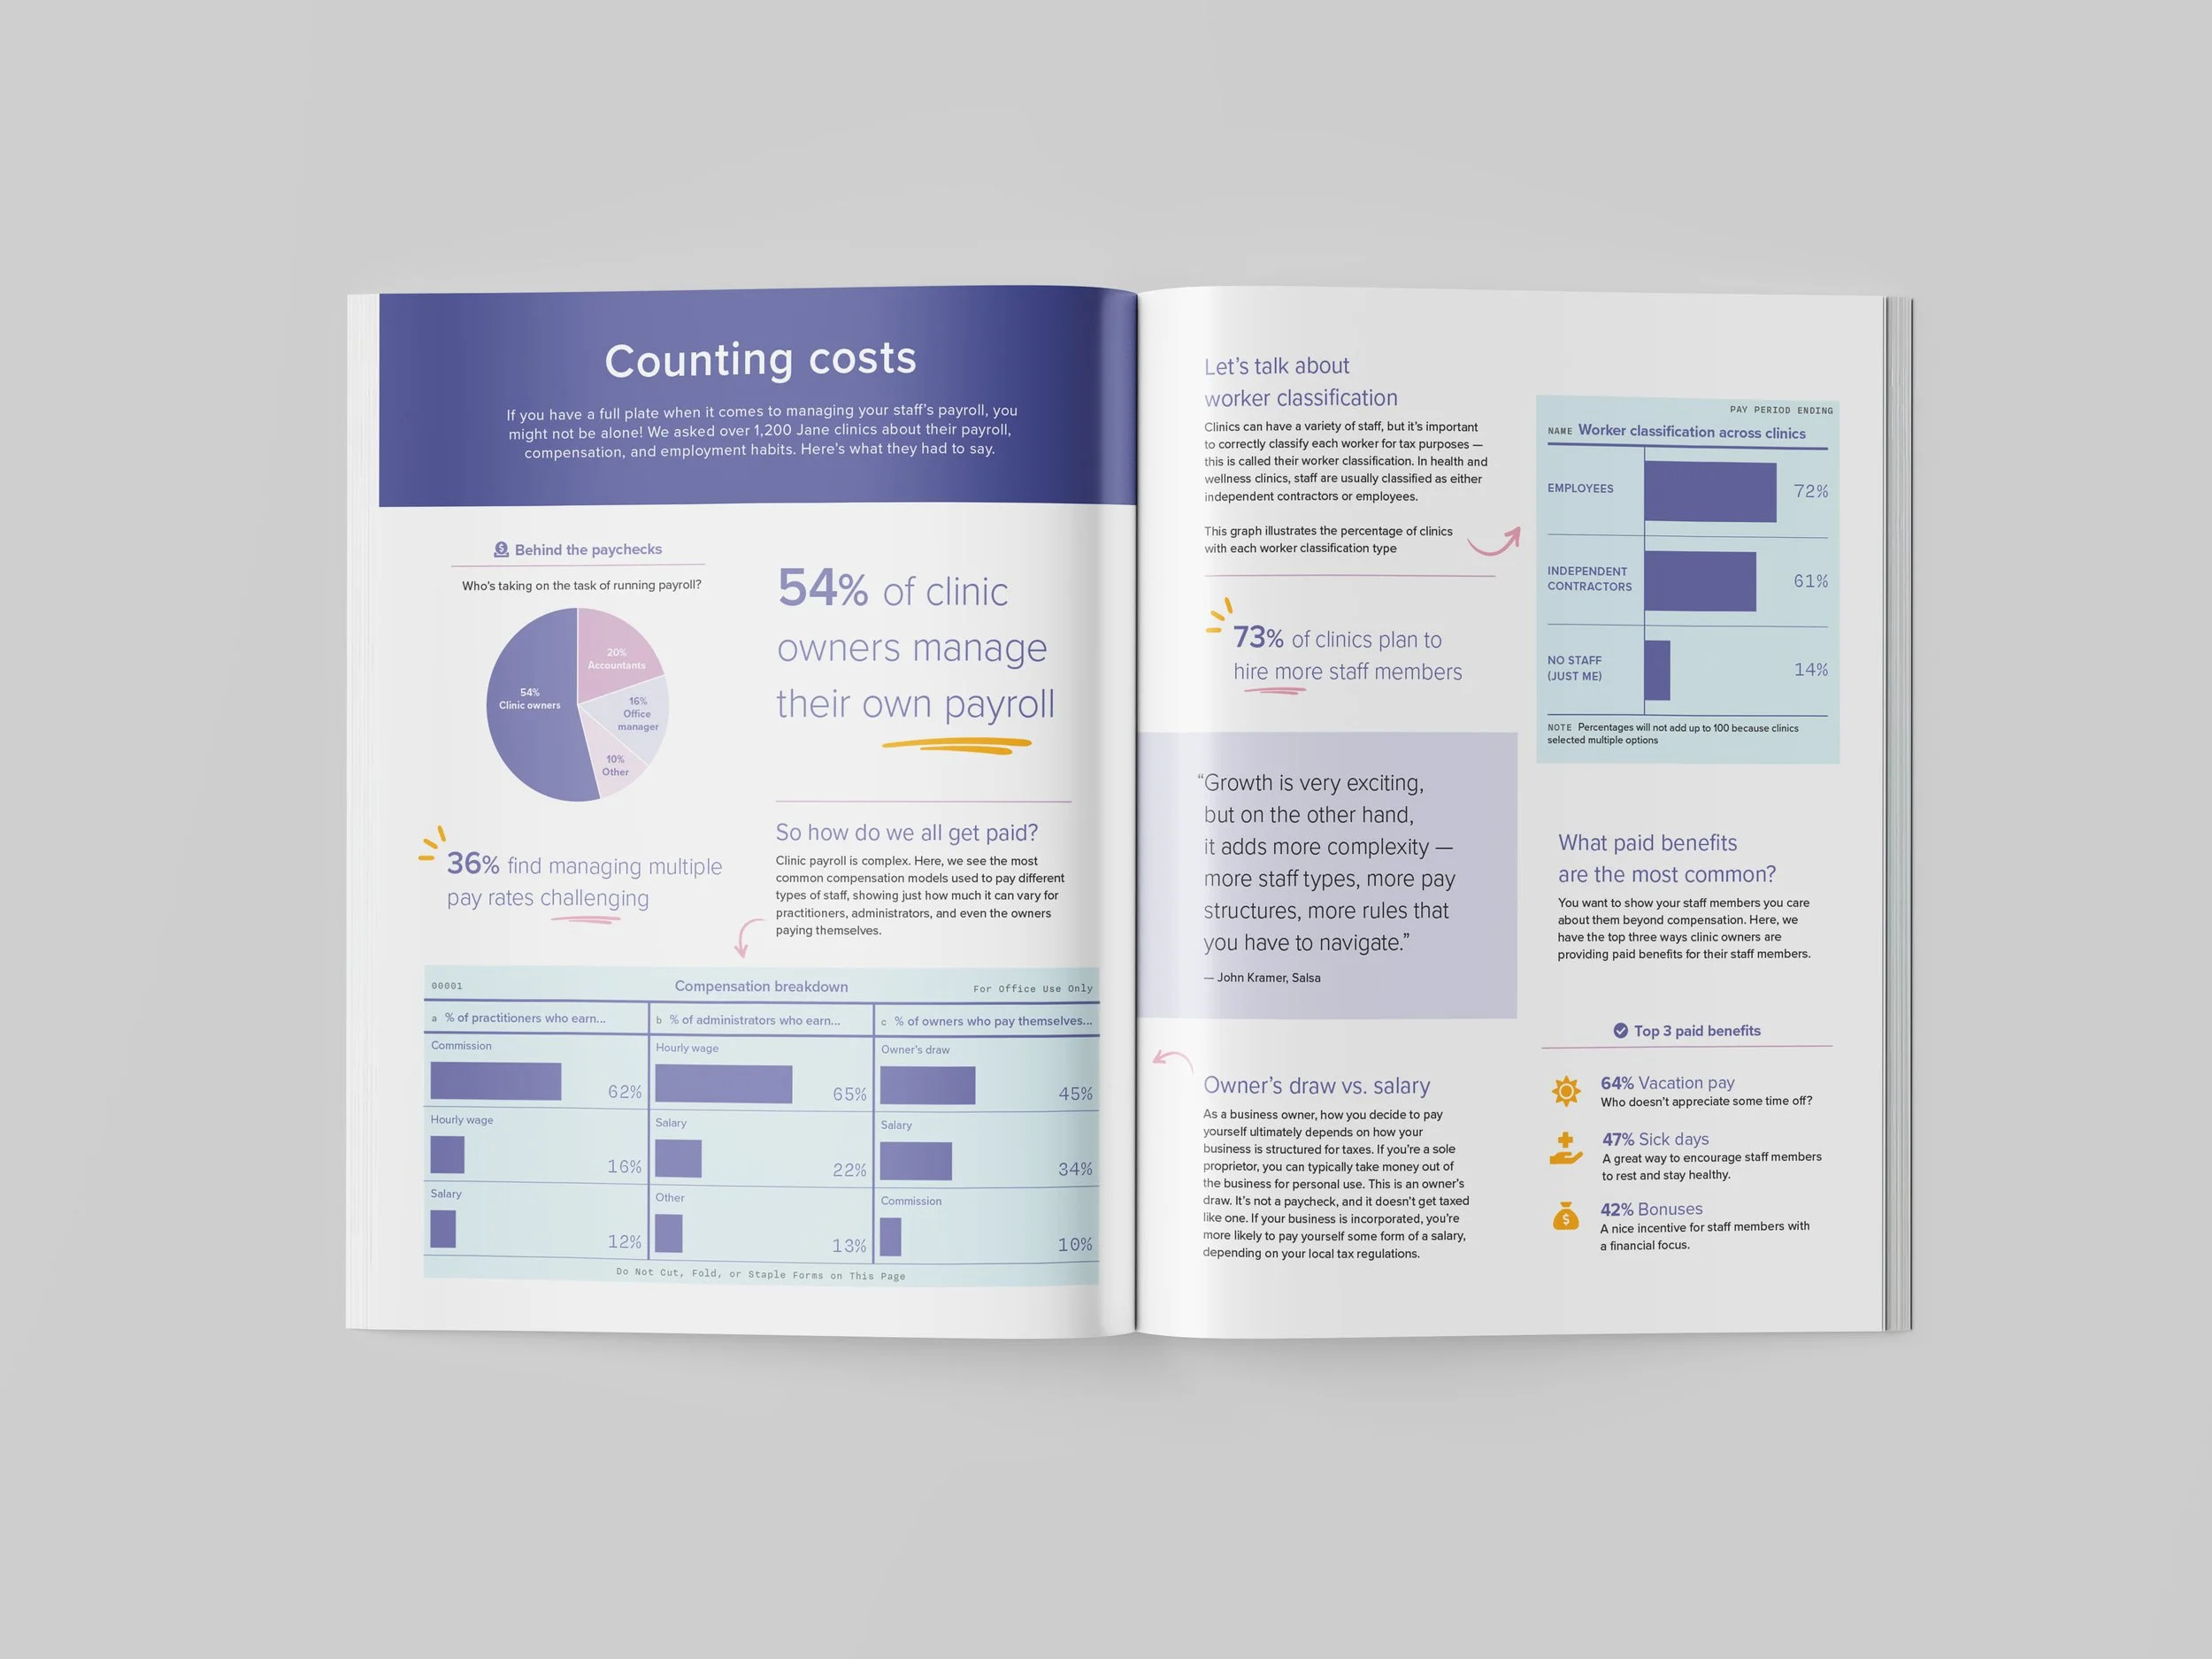
“Counting costs” and its associated article focuses on staff payroll, compensation and employment habits. It breaks down how clinics are managing payroll and what they find challenging. The data showed us how much payroll responsibility clinic owners are taking on themselves.
A week in the life clinic
Counting costs
“Michelle has a real gift for making complex topics (like finance!) easy to understand. In Front Desk magazine, her infographics have shed light on how clinic owners pay their staff, and how practitioners are growing their businesses. This is especially helpful during periods of growth, giving our readers clarity and confidence to make decisions about hiring and scaling their health and wellness businesses.”
Our collaborative impact
— Vasiliki Marapas, Content Marketing Manager, Jane App